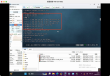
ELK experiment (3) install Kibana
Download and install the linux package
Wget https://artifacts.elastic.co/downloads/kibana/kibana-6.2.3-linux-x86_64.tar.gz
Shasum-a 512 kibana-6.2.3-linux-x86_64.tar.gz
Tar-xzf kibana-6.2.3-linux-x86_64.tar.gz
Cd kibana-6.2.3-linux-x86_64/
Download and install the Darwin package
Curl-O https://artifacts.elastic.co/downloads/kibana/kibana-6.2.3-darwin-x86_64.tar.gz
Shasum-a 512 kibana-6.2.3-darwin-x86_64.tar.gz
Tar-xzf kibana-6.2.3-darwin-x86_64.tar.gz
Cd kibana-6.2.3-darwin-x86_64/
Configuration referenc
Https://www.elastic.co/guide/en/kibana/current/settings.html
Running
. / bin/kibana

Port 9200 is not open. I'll turn on es first.

Netstat-lntup | grep 9* ports are all up
Remote access is not available, ip is not bound, allow me to update the configuration
Vi kibana.yml
Server.host: "192.168.14.66"
Elasticsearch.url: "http://192.168.14.66:9200"
Run in the background
Nohup. / bin/kibana &
Kibana status turns green.
Web page status
Http://192.168.209.160:5601/status#?_g=()
Add data and custom data sources
Http://192.168.209.160:5601/app/kibana#/home
This component also basically belongs to the 0 configuration, because there is no logstash, so the report has no data, so go to the installation of the next component.
Video guidance
High-level Kibana introduction, pie chartsData discovery, bar charts, and line chartsCoordinate mapsEmbedding Kibana visualizations