Analysis of memory deadlock in JVM
Phenomenon:
It was found that applications running on tomcat, no matter how many vusers simulate the request pressure, the cpu will consume 200%, and the tps of the application is very low, nearly 10 times per second.
Analysis:
1. Bottleneck elimination of network
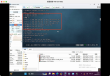
2. Execute jstack -l Thread No.> Thread No. log
Log as follows:
3. It can be seen that one of the memory variables of 0x00000751968760 is locked, and the other is acquiring locks, resulting in deadlock problems. Next, optimize the code